Measure OOH impact through audience exposure metrics, not just impressions
OOH effectiveness in Hong Kong hinges on quantifying actual audience exposure, not just estimating impressions. This means tracking how many people see your ad in contexts where they can act on it—like during commutes or shopping trips. The distinction matters because generic impression counts ignore whether the audience is receptive or engaged.
For example, a static ad near a transit hub captures more daily exposure than a digital screen in a quiet area, but only if the audience is moving through that space during relevant times. Measuring actual exposure ensures your budget aligns with real-world behavior patterns. Utilize the Geospatial Exposure Index (GEI) framework, which cross-references foot traffic data from Hong Kong’s Transport Department with campaign timing to calculate contextual relevance scores for each site, ensuring exposure metrics reflect actual behavioral engagement rather than mere presence.
Key factors driving measurement decisions: audience context and campaign goals
Effective OOH measurement requires matching audience context to campaign objectives. A brand aiming for brand lift needs different metrics than one seeking direct response. The trade-off is between broad reach and precise behavioral targeting.
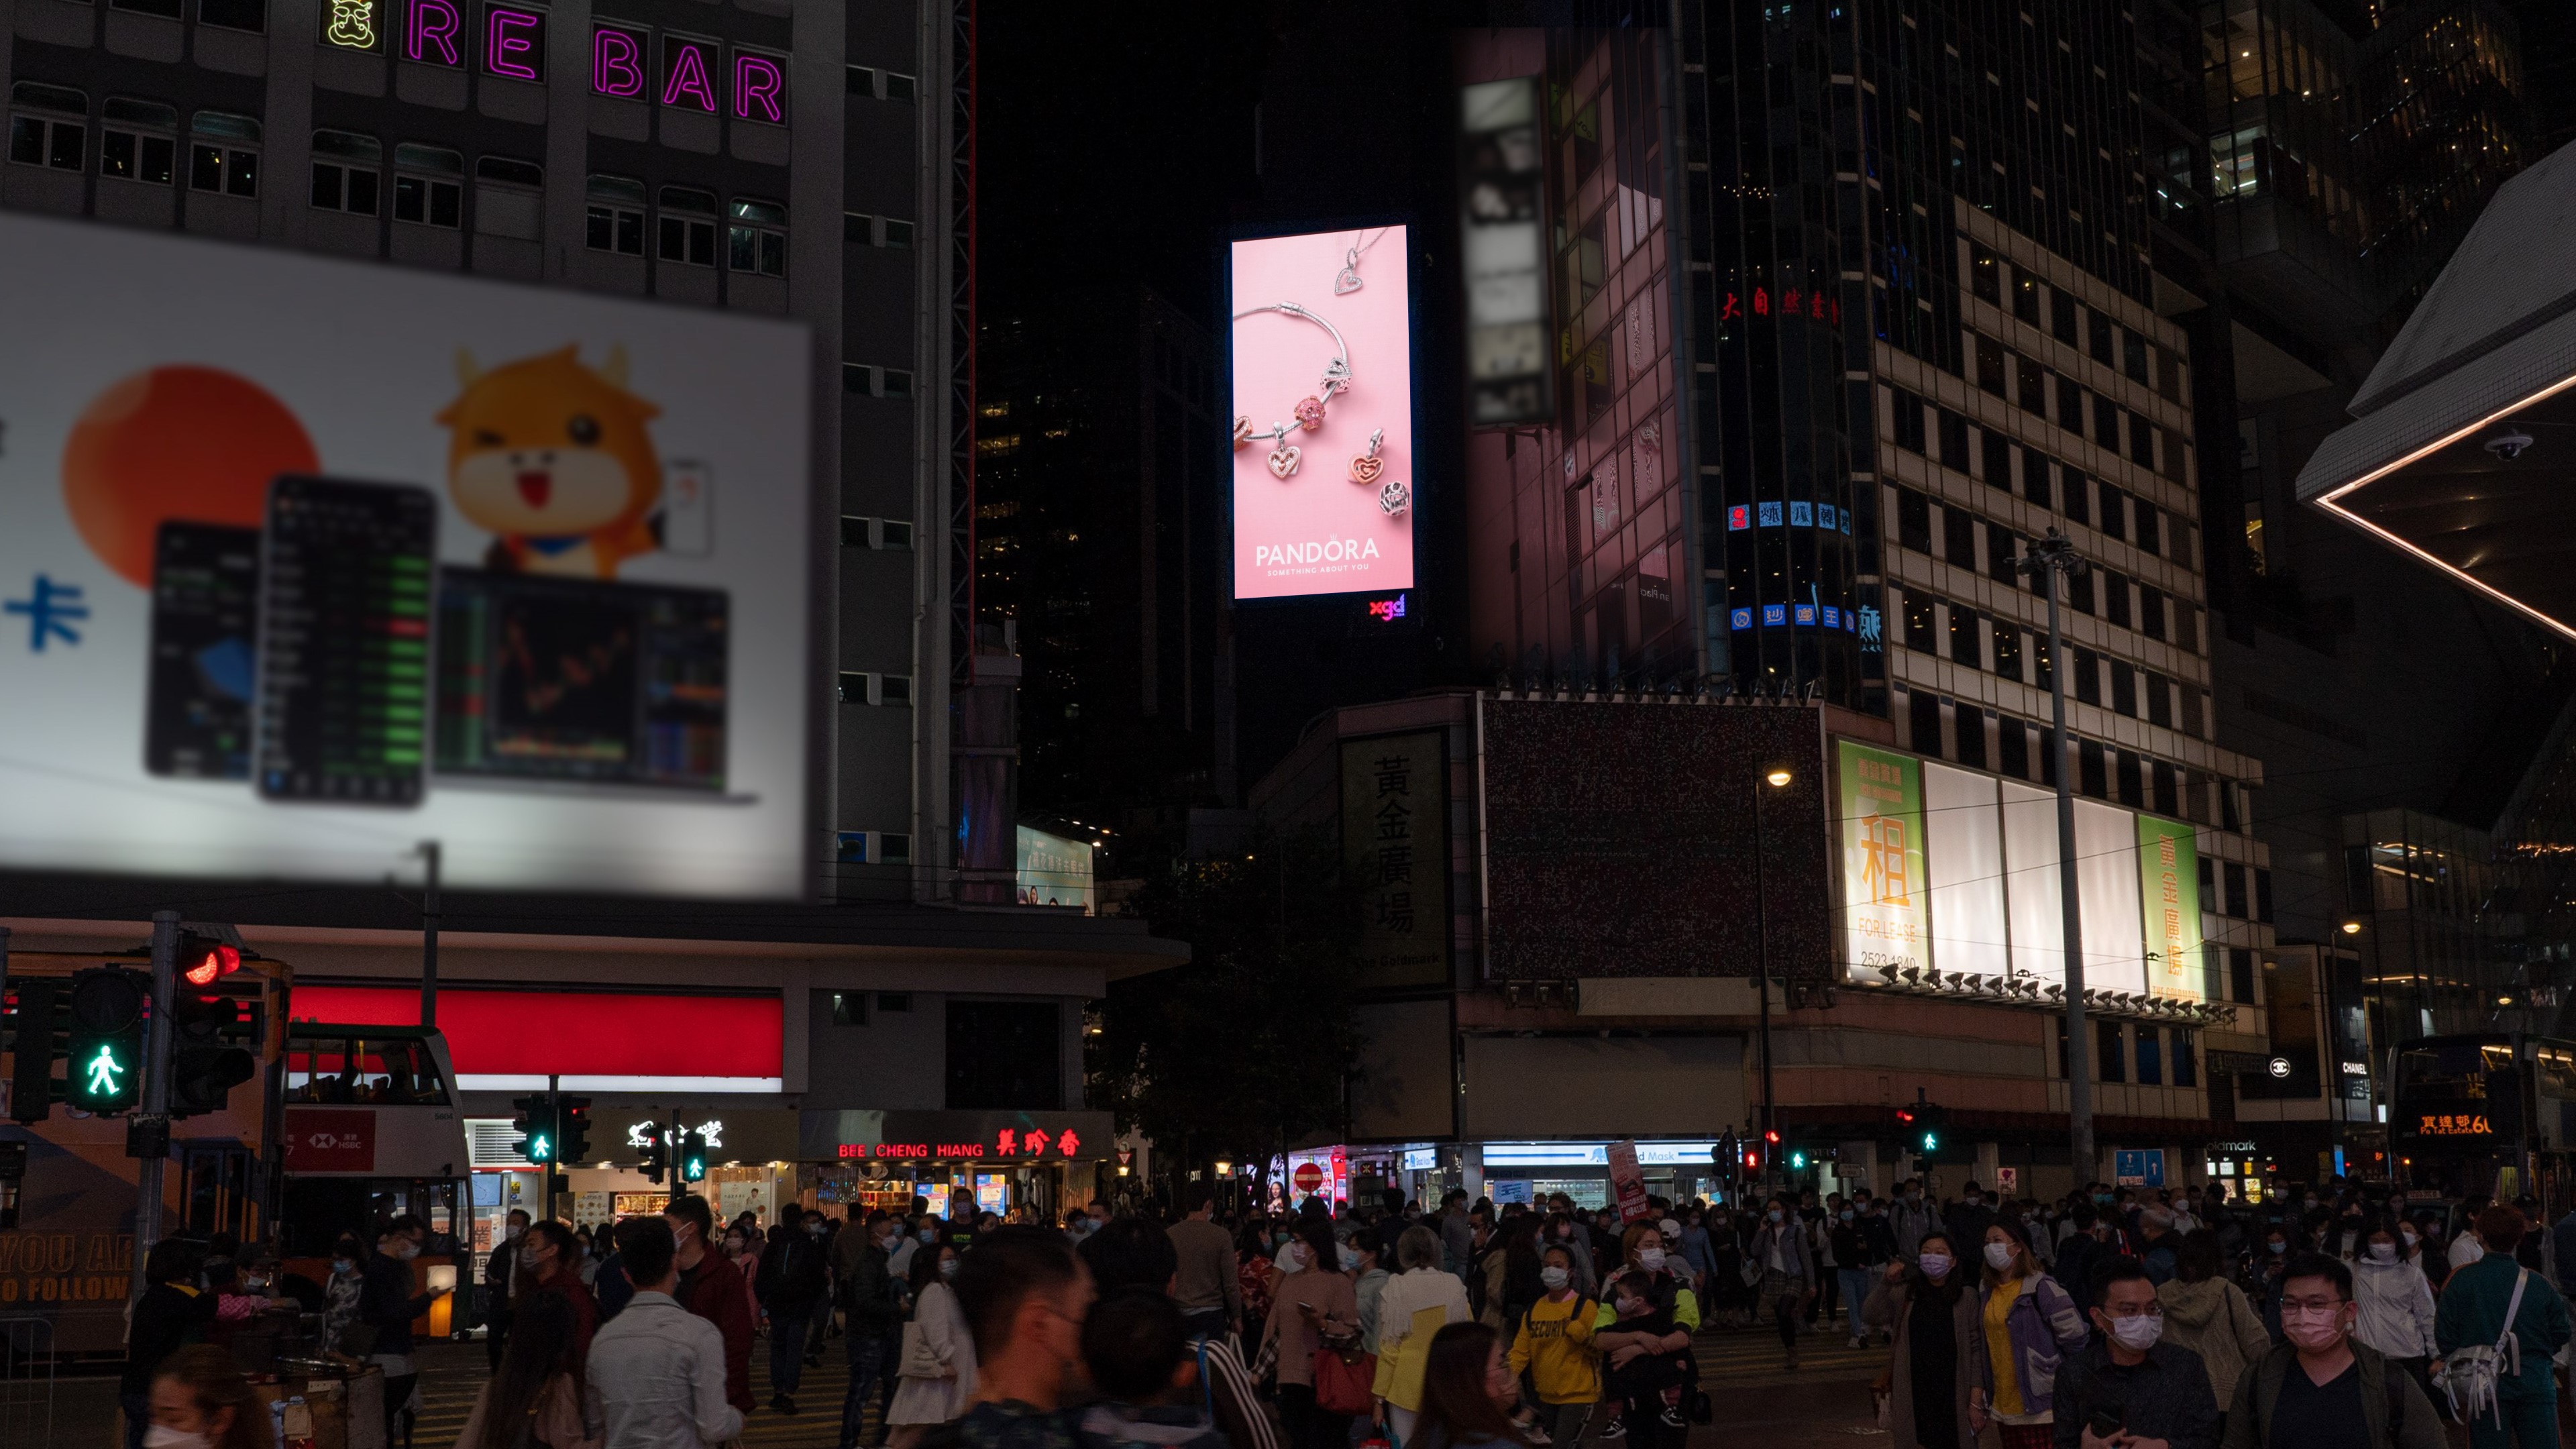
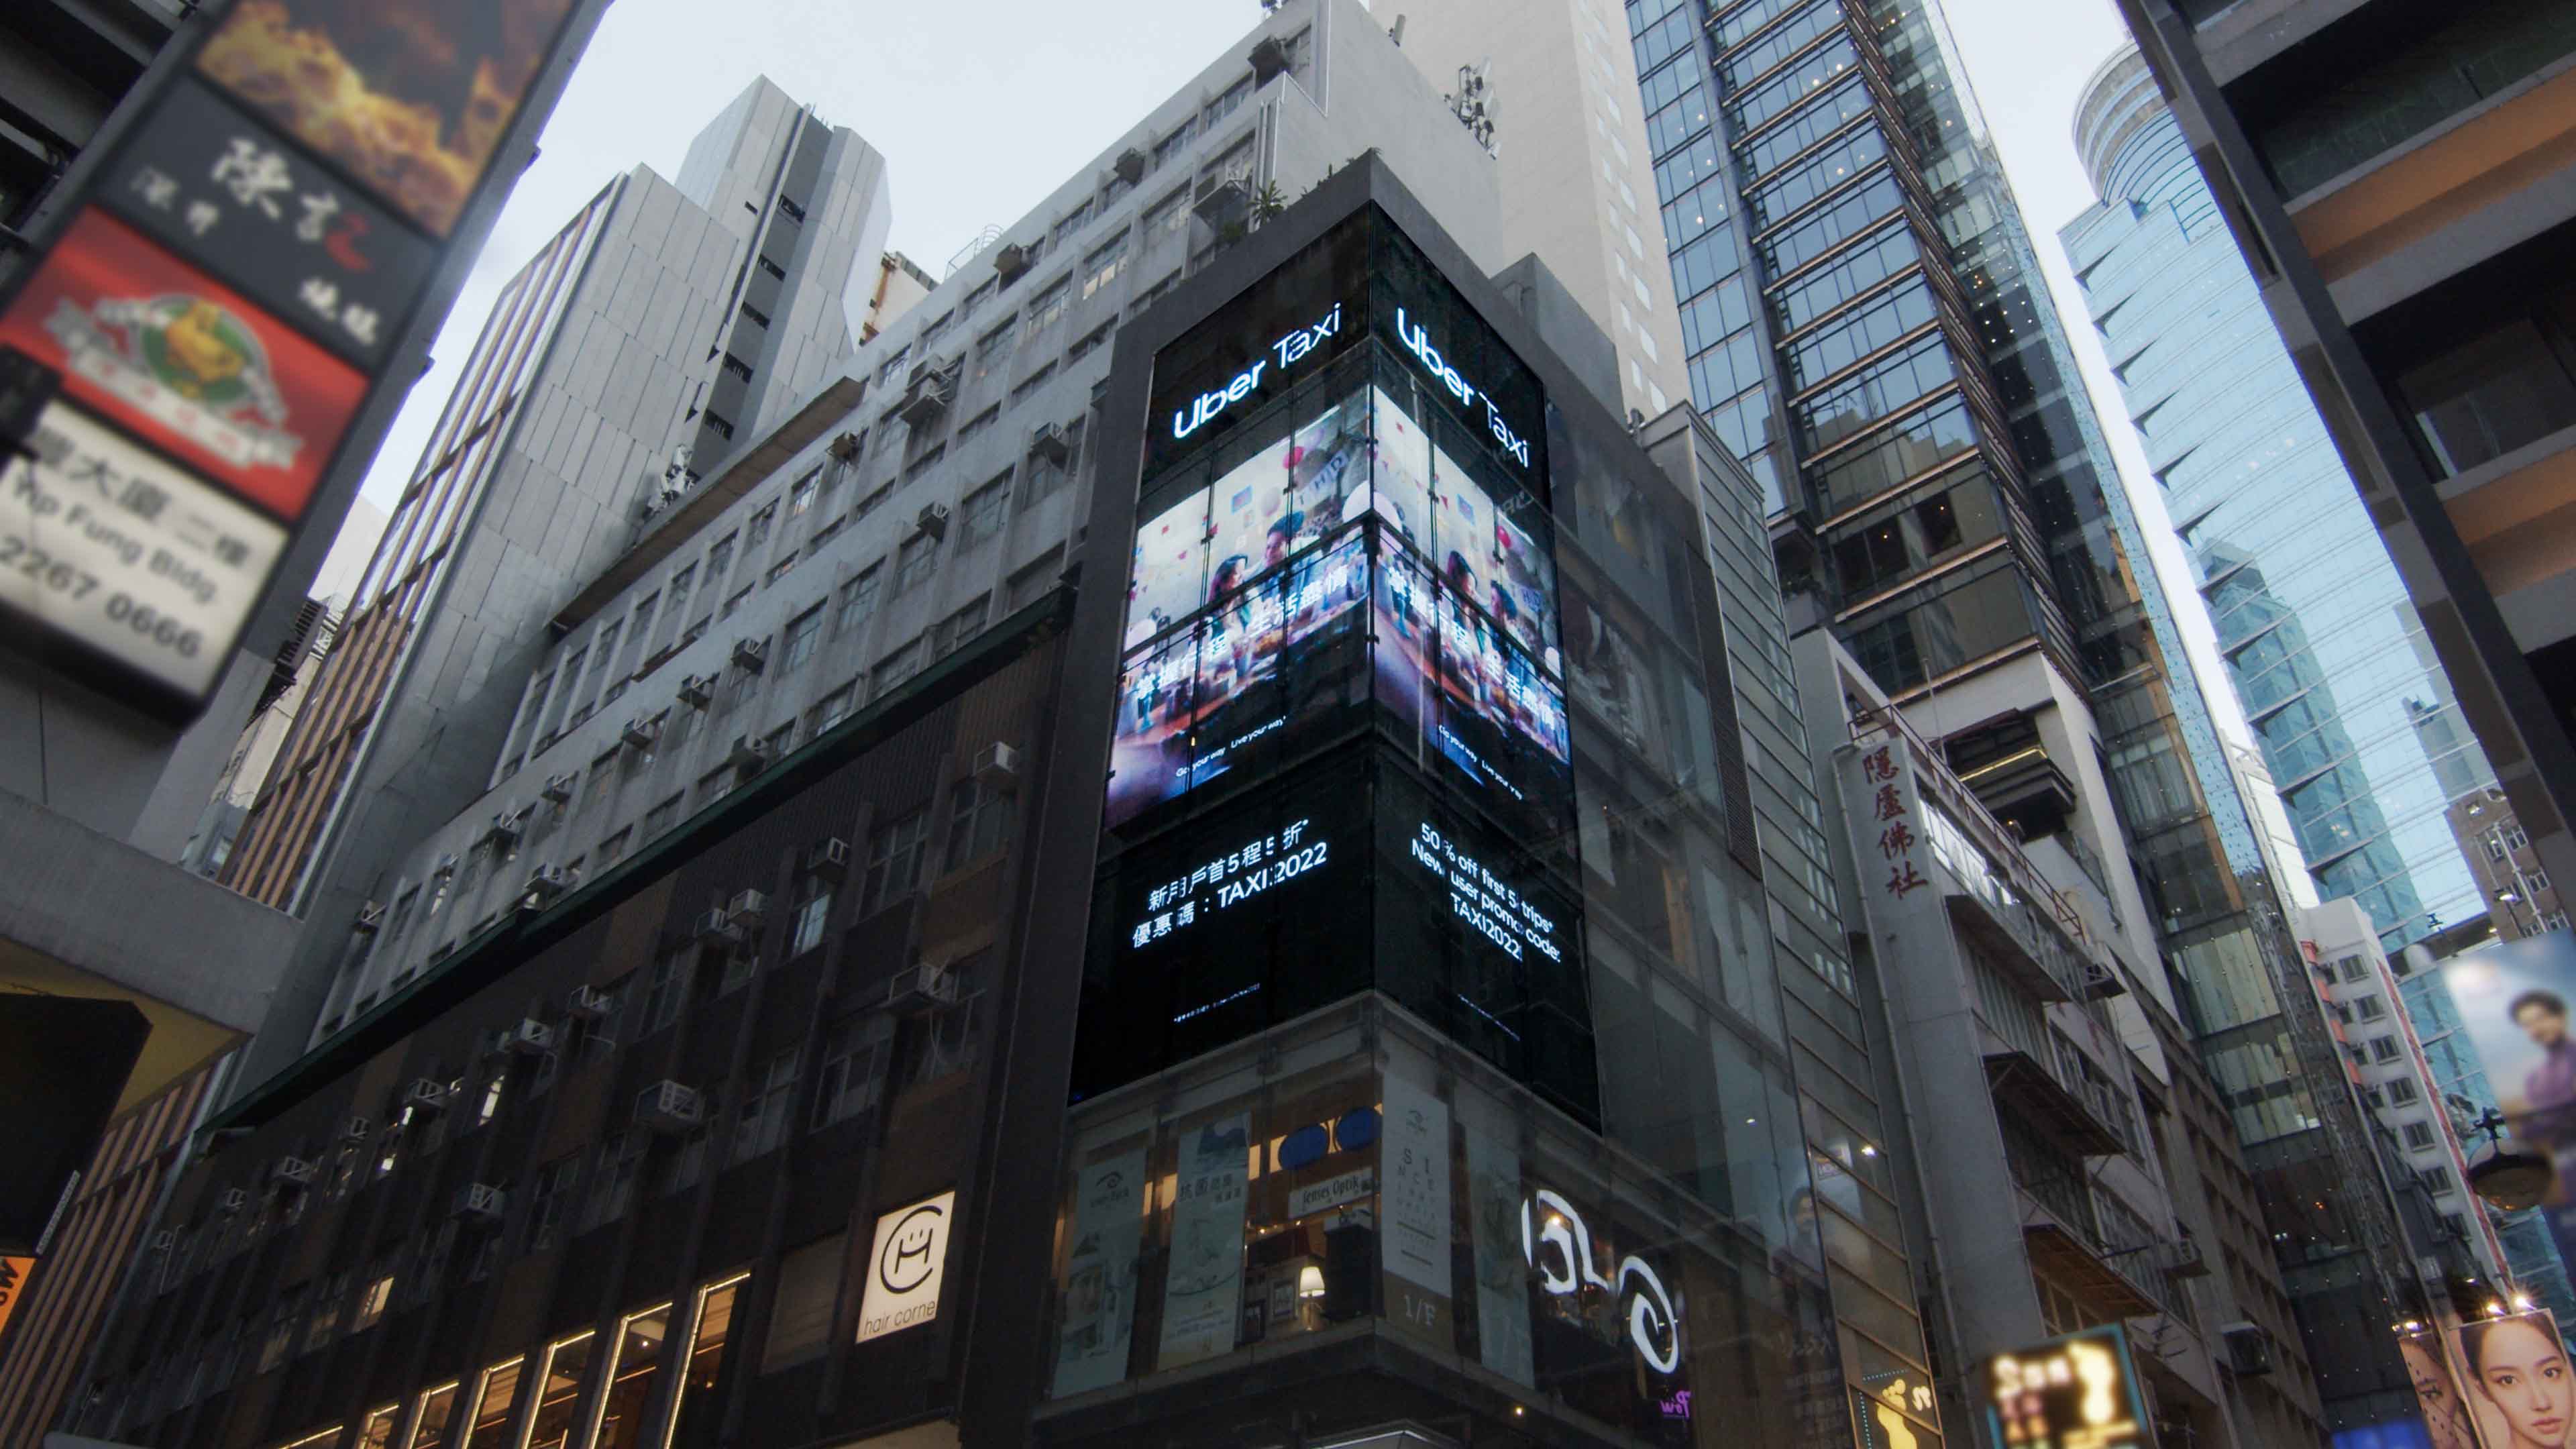
For instance, high-traffic zones like Causeway Bay (2.2 million monthly pedestrians) offer broad exposure, while transit corridors (455,170 daily vehicles in Central) provide contextually relevant exposure during commutes. Choosing the right metric depends on whether you need to reach a mass audience or influence specific behaviors. Leverage the Contextual Relevance Matrix (CRM), a tool developed by Hong Kong’s Advertising Standards Council, to map audience demographics against location-specific traffic patterns, ensuring that exposure metrics align with both audience composition and behavioral timing.
Apply measurement frameworks through contextual audience mapping
Map your target audience's daily routines to physical locations to identify where exposure aligns with behavior. This avoids the trap of measuring exposure in isolation without considering when and why people move through those spaces.
Start by identifying key locations where your audience spends time—like shopping districts or transit hubs—and cross-reference with traffic and pedestrian data. For example, a campaign near LFR in Causeway Bay (6.2 million monthly pedestrians) should align with evening shopping hours, not midday office hours. Avoid mapping exposure to locations without verifying audience movement patterns. Implement the Temporal-Spatial Mapping (TSM) methodology, which uses anonymized mobile data from telecom providers to track movement patterns across Hong Kong’s districts, allowing advertisers to pinpoint optimal exposure windows for specific audience segments.
Practical questions about measurement
How do I know if my OOH placement is reaching the right audience?
Verify audience context by cross-referencing site location with traffic and pedestrian data. For example, a site in Causeway Bay (2.2 million monthly pedestrians) aligns with evening shopping hours, while Central (455,170 daily vehicles) suits commute times. This ensures exposure matches audience behavior patterns. Use the Location-Audience Alignment Tool (LAAT), a free resource provided by Hong Kong’s Urban Development Authority, to overlay demographic data with real-time foot traffic maps for precise audience targeting.
Can I measure OOH effectiveness without digital tracking?
Yes, by using physical location data like pedestrian counts and traffic flow. For instance, the LFR site in Causeway Bay sees 6.2 million pedestrians monthly, which provides a baseline for exposure. Combine this with campaign timing to estimate behavioral relevance without digital tools. Employ the Manual Foot Traffic Count Protocol (MFTCP), a standardized method used by Hong Kong’s Public Transport Authority, to conduct on-site counts during peak hours, ensuring accuracy without digital dependency.
What if my campaign runs during off-peak hours?
Adjust exposure metrics to account for reduced audience movement. For example, a campaign during midday office hours at a transit hub may see lower pedestrian counts than evening hours. Use historical traffic data to normalize exposure metrics and avoid overestimating reach during low-traffic periods. Apply the Peak Hour Normalization Factor (PHNF), a metric derived from Hong Kong’s Transport Department’s decade-long traffic datasets, to adjust exposure counts based on historical patterns for each location and time slot.
Close the loop by aligning exposure with campaign outcomes
Effectiveness isn't just about how many people see your ad—it's about whether that exposure drives the intended action. For example, a campaign near a transit hub during commute times may boost brand recall, while one near a shopping district during evening hours may drive foot traffic.
Always tie exposure metrics to specific campaign goals. If the goal is brand awareness, focus on high-traffic locations with consistent audience movement. If the goal is direct response, align exposure with times when audiences are actively seeking products or services. Adopt the Outcome-Driven Exposure Framework (ODEF), which links exposure data to post-campaign sales or survey data, allowing advertisers to quantify the direct impact of OOH placements on consumer behavior.